
Flowchart
รูปแบบ Sequence
รูปแบบ Decision
รูปแบบ Loop หรือ lteration
รูปแบบ Sequence
Easy Flowchart Software
SmartDraw, the world's first visual processorTM, creates your visuals for you. Simply input your information, and SmartDraw does the rest, aligning everything automatically and applying professional design themes for presentation-quality results every time.
Top reasons SmartDraw is the ideal flowchart software:
- Automatic Formatting
- Click simple commands and SmartDraw builds your flowchart for you, automatically. Add or remove a box, and SmartDraw realigns and arranges all the elements so that everything looks great.
- Quick-Start Templates
- Over 60 professionally-designed flowchart examples make you instantly productive. Simply choose the flowchart template that is most similar to your project, and customize it to suit your needs.
- Free Support
- Got a question? Call or email us. SmartDraw experts are standing by ready to help, for free!
What flowcharts are and how they help you:
A flowchart uses shapes connected by lines to show the steps in a process. By visualizing the process, a flowchart can quickly help identify bottlenecks or inefficiencies where the process can be streamlined or improved.
Here are some of the ways flowcharts are used:
- Documenting a business process
- Optimizing a business process
- Training new employees
Discover why SmartDraw is the ideal flowcharting software. Try SmartDraw FREE.
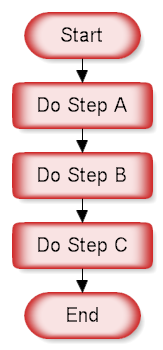


(Sequence)
รูปแบบ Decision

A flowchart is a type of diagram that represents an algorithm, workflow or process, showing the steps as boxes of various kinds, and their order by connecting them with arrows. This diagrammatic representation illustrates a solution model to a given problem. Flowcharts are used in analyzing, designing, documenting or managing a process or program in various fields.[
The first structured method for documenting process flow, the "flow process chart", was introduced by Frank Gilbreth to members of the American Society of Mechanical Engineers (ASME) in 1921 in the presentation “Process Charts—First Steps in Finding the One Best Way”. Gilbreth's tools quickly found their way into industrial engineering curricula. In the early 1930s, an industrial engineer, Allan H. Mogensen began training business people in the use of some of the tools of industrial engineering at his Work Simplification Conferences in Lake Placid, New York.
A 1944 graduate of Mogensen's class, Art Spinanger, took the tools back to Procter and Gamble where he developed their Deliberate Methods Change Program. Another 1944 graduate, Ben S. Graham, Director of Formcraft Engineering at Standard Register Industrial, adapted the flow process chart to information processing with his development of the multi-flow process chart to display multiple documents and their relationships. In 1947, ASMEadopted a symbol set derived from Gilbreth's original work as the "ASME Standard: Operation and Flow Process Charts."
Douglas Hartree in 1949 explained that Herman Goldstine and John von Neumann had developed a flowchart (originally, diagram) to plan computer programs. His contemporary account is endorsed by IBM engineers and by Goldstine's personal recollections. The original programming flowcharts of Goldstine and von Neumann can be seen in their unpublished report, "Planning and coding of problems for an electronic computing instrument, Part II, Volume 1" (1947), which is reproduced in von Neumann's collected works.Besides describing the logical flow of control, flowcharts allowed programmers to lay out machine language programs in computer memory before the development of assembly languages and assemblers.
Flowcharts used to be a popular means for describing computer algorithms and are still used for this purpose. Modern techniques such as UML activity diagrams and Drakon-charts can be considered to be extensions of the flowchart. In the 1970s the popularity of flowcharts as an own method decreased when interactive computer terminals and third-generation programming languages became the common tools of the trade, since algorithms can be expressed much more concisely as source code in such a language, and also because designing algorithms using flowcharts was more likely to result in spaghetti code because of the need for gotos to describe arbitrary jumps in control flow. Often pseudo-code is used, which uses the common idioms of such languages without strictly adhering to the details of a particular one.

2. การเลือกกระทำตามเงื่อนไข
(Decision or Selection)
การตัดสินใจ หรือเลือกเงื่อนไขคือ เขียนโปรแกรมเพื่อนำค่าไปเลือกกระทำ โดยปกติจะมีเหตุการณ์ให้ทำ 2 กระบวนการ คือเงื่อนไขเป็นจริงจะกระทำกระบวนการหนึ่ง และเป็นเท็จจะกระทำอีกกระบวนการหนึ่ง แต่ถ้าซับซ้อนมากขึ้น จะต้องใช้เงื่อนไขหลายชั้น เช่นการตัดเกรดนักศึกษา เป็นต้น ตัวอย่างผังงานนี้ จะแสดงผลการเลือกอย่างง่าย เพื่อกระทำกระบวนการเพียงกระบวนการเดียว
รูปแบบ Loop หรือ lteration
Building Loops Using Iteration Statements
The next set of statements we’ll look at are the iteration statements, which are used to build loops in C. Loops enable you to execute one or more statements multiple times. You can specify that your loop is to be executed a specific number of times, or you can iterate until a specified condition occurs. C# offers four iteration statements, each of which is well-suited for a specific kind of loop.
The for Loop
The for loop is used to execute a loop until a specified condition becomes true, as follows:
for(initialization; condition; iteration)
controlled-statement;
One of the benefits of using the for loop is that all the conditions for initializing and maintaining the loop are located in one place, at the top of the loop.
The for loop has four components: the initialization expression, the conditional expression, the controlled statement, and the iteration expression. These components are executed in the following order:
The initialization expression is run once when the for loop begins execution.
The conditional expression is evaluated to determine whether the for loop should continue executing; if the expression has a value of false, control passes to the statements after the for loop.
The controlled statement is executed if the conditional expression evaluates to true.
The iteration expression is executed once after each execution of the controlled statement.
The algorithm for the for loop is shown in Figure 5-1.
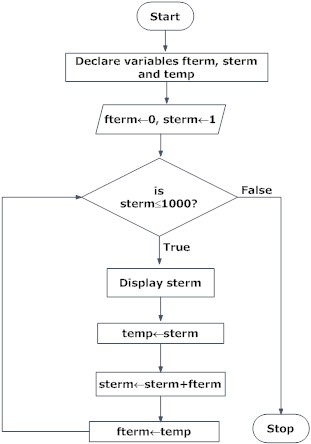
3. การทำซ้ำ
(Repeation or Loop)
การทำกระบวนการหนึ่งหลายครั้ง โดยมีเงื่อนไขในการควบคุม หมายถึงการทำซ้ำเป็นหลักการที่ทำความเข้าใจได้ยากกว่า 2 รูปแบบแรก เพราะการเขียนโปรแกรมแต่ละภาษา จะไม่แสดงภาพอย่างชัดเจนเหมือนการเขียนผังงาน ผู้เขียนโปรแกรมต้องจินตนาการด้วยตนเอง


ผังงาน (Flowchart Diagram)
|
|

ไม่มีความคิดเห็น:
แสดงความคิดเห็น